Maritime Supply Corridors
Tracking the operational restructuring of global maritime freight routes, canal transit vulnerabilities, and industrial supply resilience strategies.
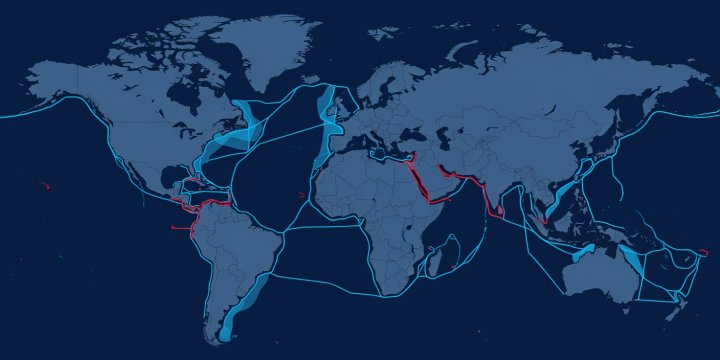
1. Geopolitical Realignment of Oceanic Choke Points
Approximately 80% of global merchandise trade by volume moves via oceanic corridors. The structural integrity of modern supply chains relies on narrow maritime choke points: the Strait of Malacca, the Suez Canal / Red Sea transit, the Panama Canal, the Strait of Hormuz, and the Turkish Straits.
Prolonged diversions around the Cape of Good Hope have absorbed approximately 6% of effective global containership capacity. While the global container fleet experienced substantial new-vessel deliveries throughout 2024 and 2025, the increased nautical mileage required to bypass the Red Sea has prevented chronic overcapacity, holding freight spot rates well above pre-disruption baselines.
| Corridor / Node | Transit Status | Average Delay | Cost Impact (Per TEU) |
|---|---|---|---|
| Cape of Good Hope (Asia-Europe) | Primary Active Route | +10 to 14 Days | +$1,200 - $1,600 |
| Panama Canal | Normalized Draft Levels | +1 to 2 Days | Auction Surcharges Variable |
| Strait of Malacca | Unimpeded High Volume | Nominal | Standard Bunker Fees |
| Trans-Pacific Eastbound | Elevated Port Utilization | +2 to 4 Days | +$400 - $700 |
2. Nearshoring vs. 'Friendshoring': Empirical Manifestations
While rhetoric around nearshoring has dominated corporate earnings calls, the empirical data reveals nuanced supply chain reconfiguration. Instead of complete repatriation to domestic manufacturing bases, industrial enterprises have executed "connector country" strategies.
Economies such as Mexico, Vietnam, Poland, and Morocco have seen sharp increases in foreign direct investment and intermediate goods importation. These nations assemble components sourced from East Asian producers before exporting finished goods under preferential free trade agreements into the United States and European Union. As a result, supply chains have elongated rather than shortened, adding intermediate handling stages and regulatory compliance overhead.
Case Study: Mexican Manufacturing Value Added
Over 42% of intermediate components utilized in Mexican automotive and electronic exports to North American trade partners originate from non-USMCA suppliers, illustrating the interdependence of interconnected international supply systems.
3. Port Automation and Inventory Optimization Models
To hedge against transport delays, global manufacturers have definitively abandoned pure "just-in-time" inventory models in favor of "just-in-case" safety buffer stocks. This shift requires significant expansion of inland bonded warehouse hubs adjacent to major entry ports such as Rotterdam, Antwerp, Los Angeles, and Singapore.
Furthermore, terminal operators are deploying automated guided vehicles (AGVs), OCR-enabled container processing gates, and predictive berth scheduling platforms to compress dwell times. The competitive advantage in global trade is increasingly governed by port clearance velocity rather than oceanic transit speed alone.